The rate and extent of chemical change
Work through one section at a time. Higher-only material is labelled explicitly; optional challenges can also use Foundation content.
 GCSE CHEMISTRY · AQA TRILOGYTutor dashboardSaves on this device
Your answers save automatically as you work.
Saved in this browser on this device.
Why can a tablet fizz quickly or slowly? Measure reaction rates, explain the effects of changing conditions and discover why some reactions never go fully to completion.
Supported GCSE version · Clear examples, worked calculations and optional challenges.
Work through one section at a time. Higher-only material is labelled explicitly; optional challenges can also use Foundation content.
How much reactant is used or product is made per unit time.
Average rate over a stated time interval.
A straight line touching a curve with the same slope at the chosen point.
A collision with enough energy for particles to react.
The minimum energy particles need for a reaction.
Amount of dissolved substance in a given volume of solution.
A substance that speeds a reaction without being used up overall.
Cloudiness caused by particles suspended in a liquid.
A reaction in which products can react to make the original reactants.
A system from which matter cannot escape.
Forward and reverse reactions continue at equal rates in a closed system.
The relative amounts of reactants and products at equilibrium.
Rate means how quickly a reaction happens. Measure how much reactant is used up, or how much product is made, in a known time. A reaction can be fast at first and slower later, so a mean rate describes a whole chosen interval.
Worked example: 48 cm³ of gas forms in 40 s. Mean rate = 48 ÷ 40 = 1.2 cm³/s. If 0.80 g of a gas escapes in 2 minutes, convert 2 minutes to 120 s first: 0.80 ÷ 120 = 0.0067 g/s (2 significant figures).
Rearrange when needed: quantity changed = rate × time; time = quantity changed ÷ rate. Use the change during the specified interval, not always the total from the start.
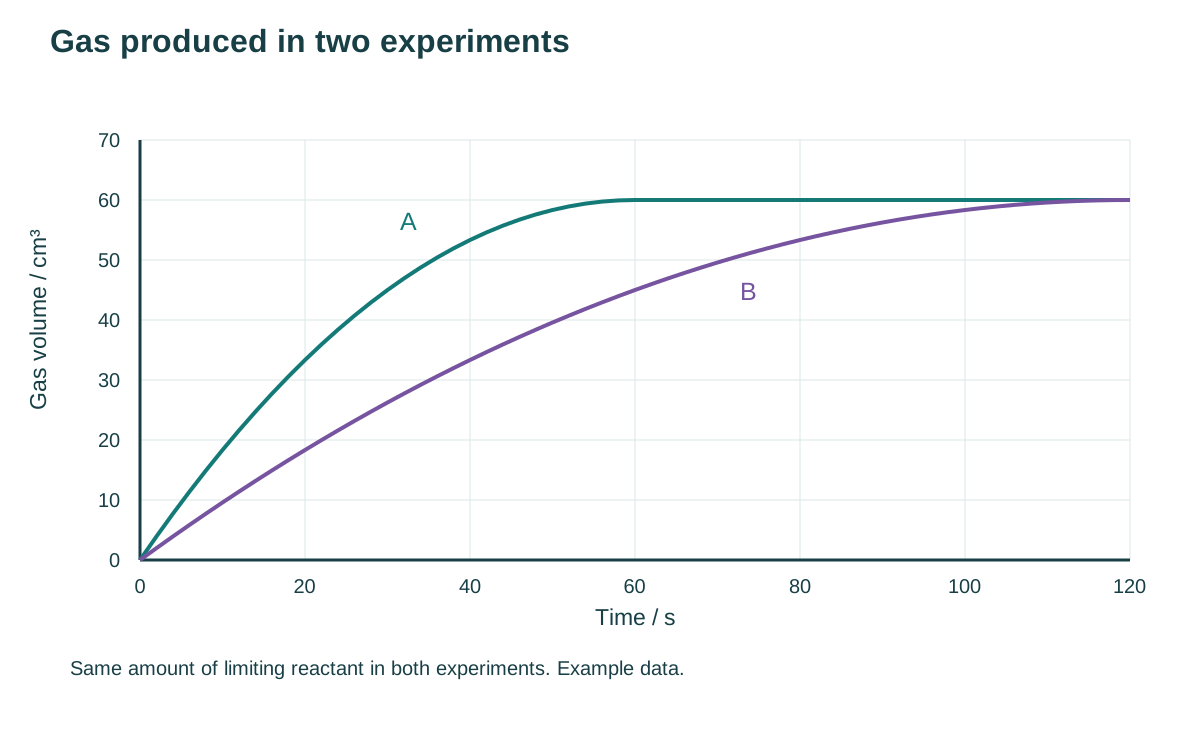
On a product-versus-time graph, a steeper slope means a faster reaction. The curve often becomes less steep as reactants are used up and there are fewer successful collisions each second. A horizontal section means no more product is forming: the measured reaction has stopped, usually because a limiting reactant is used up.
Both curves finish at the same height, so both make the same total amount of gas. A reaches this amount sooner. Faster does not automatically mean more product. A graph of reactant remaining may slope down instead; use the size of the decrease to calculate the positive reaction rate.
To draw a graph, put time on the horizontal axis and measured quantity on the vertical axis. Label units, choose evenly spaced scales, plot each pair of values accurately and draw a suitable smooth curve. Do not force a straight line through a curve.
| Time / s | Gas volume / cm³ |
|---|---|
| 0 | 0 |
| 10 | 18 |
| 20 | 32 |
| 30 | 42 |
| 40 | 48 |
| 60 | 50 |
Put time on the horizontal axis and gas volume on the vertical axis. Use even scales, label both units and plot all six points accurately. Your curve should rise and become less steep. The tangent at 20 s should be steeper than the tangent near 40 s, showing a faster rate earlier. Drawing and comparing tangents is for both tiers; calculating a tangent gradient is Higher-only.
A tangent is a straight line that touches a curve at the chosen point and follows the curve’s direction there. Its slope shows the rate at that moment. A steeper tangent means a greater rate; a horizontal tangent means zero rate.
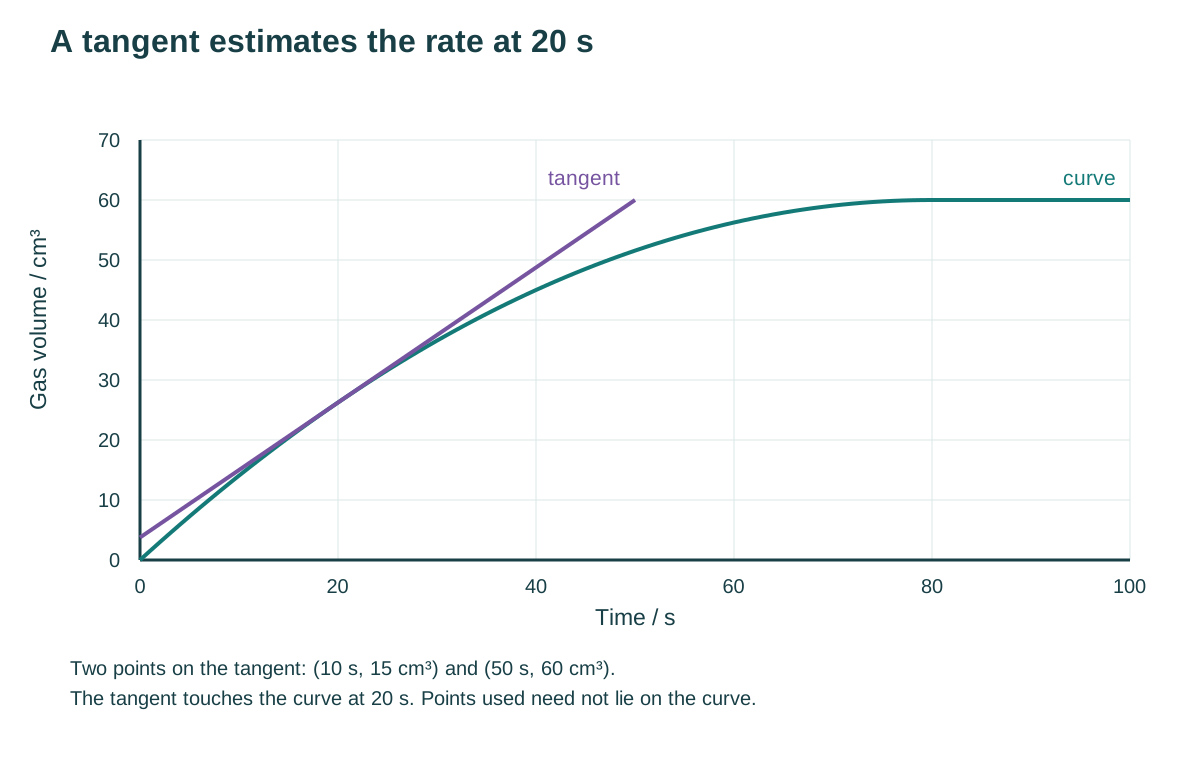
Higher only — calculating a tangent gradient: choose two points far apart on the tangent. Rate = change in volume ÷ change in time. For the labelled tangent, (60 − 15) ÷ (50 − 10) = 1.125 cm³/s, approximately 1.13 cm³/s. These points are on the tangent; they do not both need to be on the curve.
Reacting particles must collide to react, and the collision must have enough energy. The minimum required energy is the activation energy. More successful collisions each second mean a faster reaction.
Concentration: a more concentrated solution has more reacting particles in each cm³. They collide more frequently, so there are more successful collisions per second. Their average speed does not increase just because concentration increases.
Pressure: compressing reacting gases at the same temperature puts more particles in each cm³. Collisions become more frequent. This explanation applies to gas particles; it is not the explanation for changing a solid’s surface area.
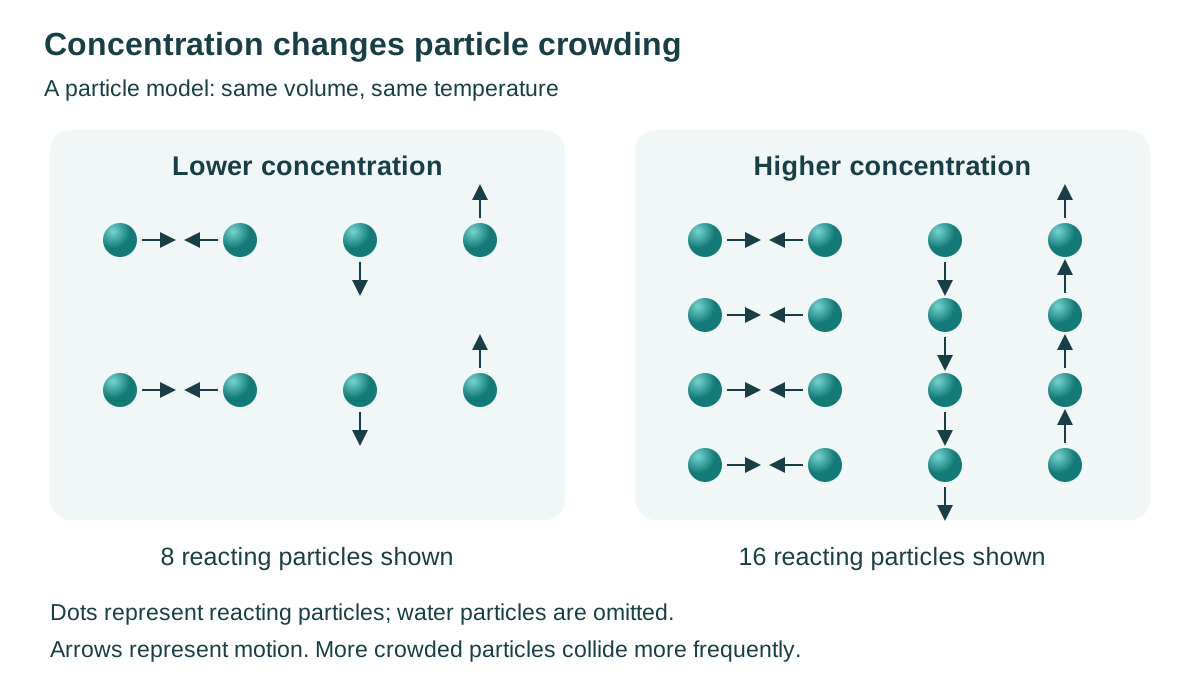
Reactant particles must collide with enough energy to react. Higher temperature increases their speed and the proportion of successful collisions. Higher concentration increases collision frequency. Joined pairs represent products.
Model limitations: Particle numbers are small, so random variation is noticeable. Colours, sizes and motion are simplified, products are drawn stationary, and the model does not represent a particular chemical reaction or measured reaction rate.
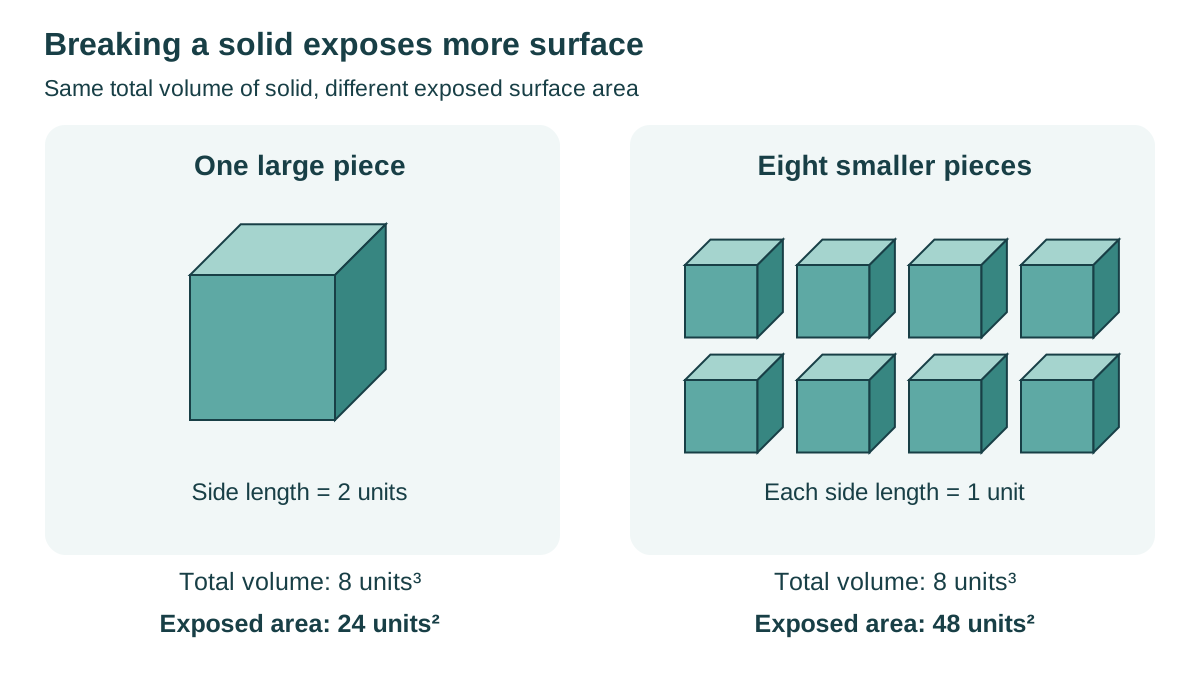
Surface area: breaking a solid into smaller pieces exposes more particles to the other reactant. A powder reacts faster than the same mass in large lumps because it has a larger surface area to volume ratio. Crushing does not create extra mass.
Temperature: hotter particles have more kinetic energy and move faster. They collide more often, and a greater proportion of collisions have energy equal to or above the activation energy. Both effects increase the number of successful collisions each second.
A simple model may predict that doubling concentration roughly doubles collision frequency if all other conditions are fixed. Real measured rates must still be checked; rate is not always directly proportional to every variable. Doubling temperature in °C does not mean doubling rate.
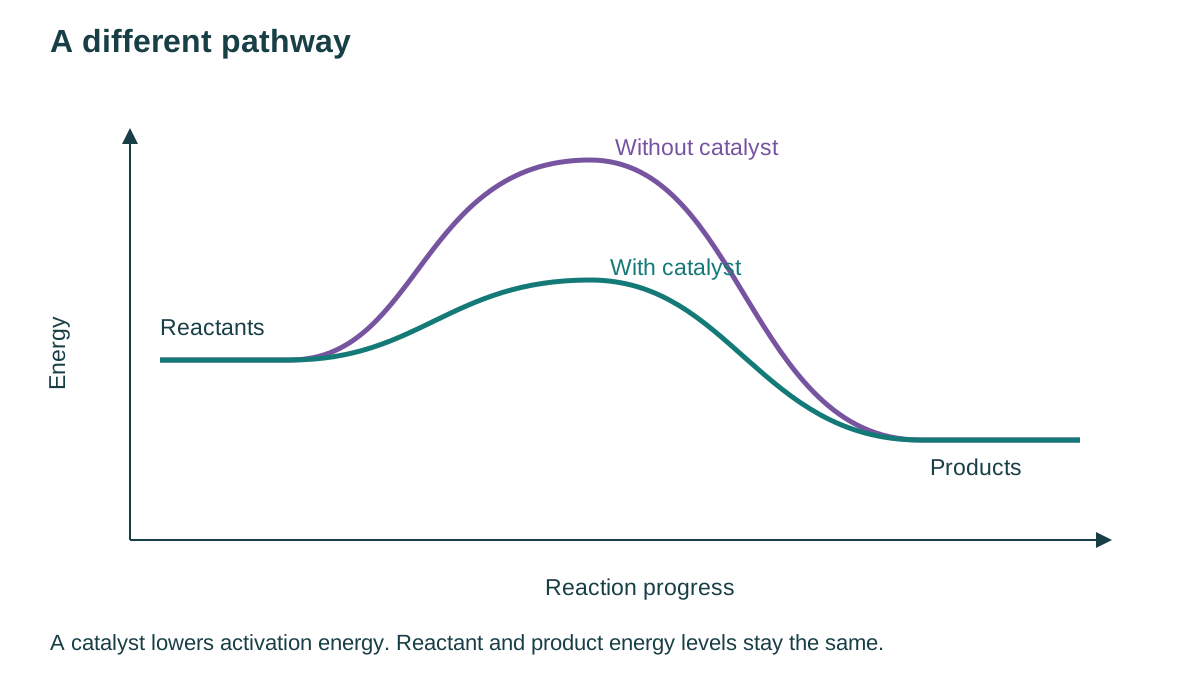
A catalyst increases a reaction’s rate without being used up overall. It provides a different reaction pathway with a lower activation energy. At the same temperature, more collisions now have enough energy to react.
Different reactions need suitable catalysts. Enzymes are biological catalysts. A catalyst is not a reactant that is gradually consumed; it is not included as a reactant or product in the overall balanced equation. It can be written above the reaction arrow.
A catalyst does not change the energy difference between reactants and products. In a reaction that already goes to completion, it does not make more product from the same amount of limiting reactant; it makes the product faster.
Aim: investigate how concentration affects rate. A testable hypothesis is: “Increasing acid concentration increases the initial rate of carbon dioxide production from a fixed mass of marble chips.”
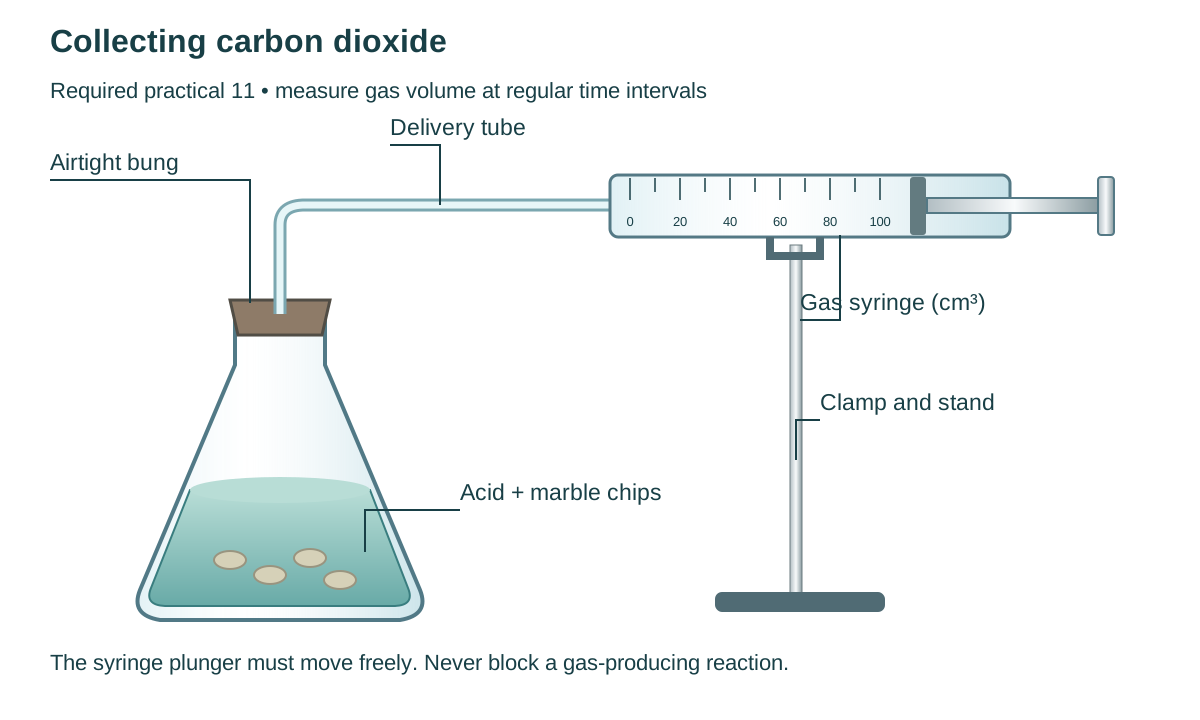
Gas lost before the bung is fitted makes the collected volume too small. Leaks have the same effect. Never seal a gas-producing reaction in apparatus with no free-moving outlet. A suitable alternative is measuring loss of mass as gas escapes, using a balance; a loose cotton-wool plug may reduce spray without trapping gas.
The second method measures a change in colour or turbidity (cloudiness). When dilute acid reacts with sodium thiosulfate solution, solid sulfur makes the mixture cloudy. Time how long it takes for a paper cross below the flask to disappear.
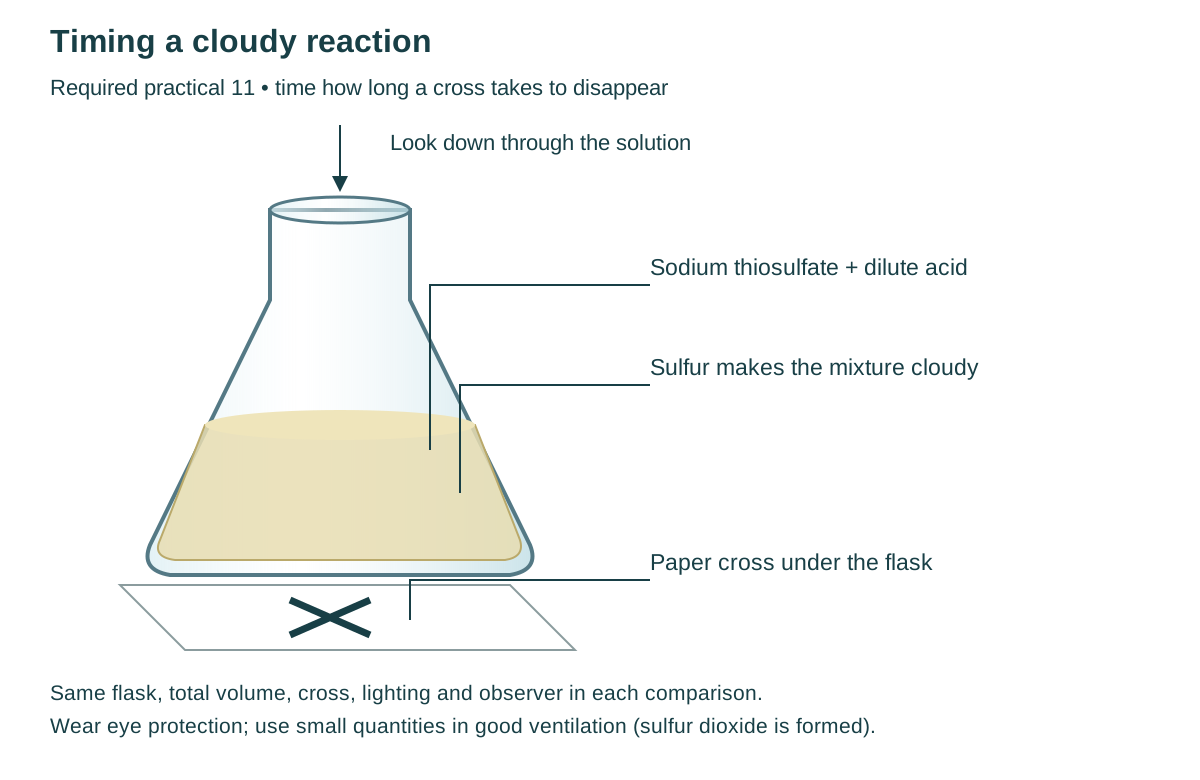
Safety: use small quantities and good ventilation because sulfur dioxide, an irritant gas, is formed. Do not lean over or inhale from the flask. Follow your teacher’s risk assessment and disposal instructions. A light sensor can make an appropriate colour/cloudiness endpoint more objective.
For fixed-endpoint experiments, 1/time is a relative rate; it is not a measured gas volume per second. If mean time is 50 s, relative rate = 1 ÷ 50 = 0.020 s⁻¹. If it is 25 s, the relative rate is 0.040 s⁻¹, twice as large.
Use repeat measurements to calculate means and assess variation. An anomalous result is unusually far from the others. Investigate it and repeat if needed. Use a recorded method problem to justify excluding a value; do not remove results merely to improve agreement.
A gas syringe records how the rate changes throughout the reaction. A disappearing-cross experiment gives one endpoint time and involves human judgement. Both can test a concentration hypothesis if the comparisons are controlled.
In a reversible reaction, products can react to form the original reactants. The symbol ⇌ represents two opposite directions. Changing conditions can favour one direction.
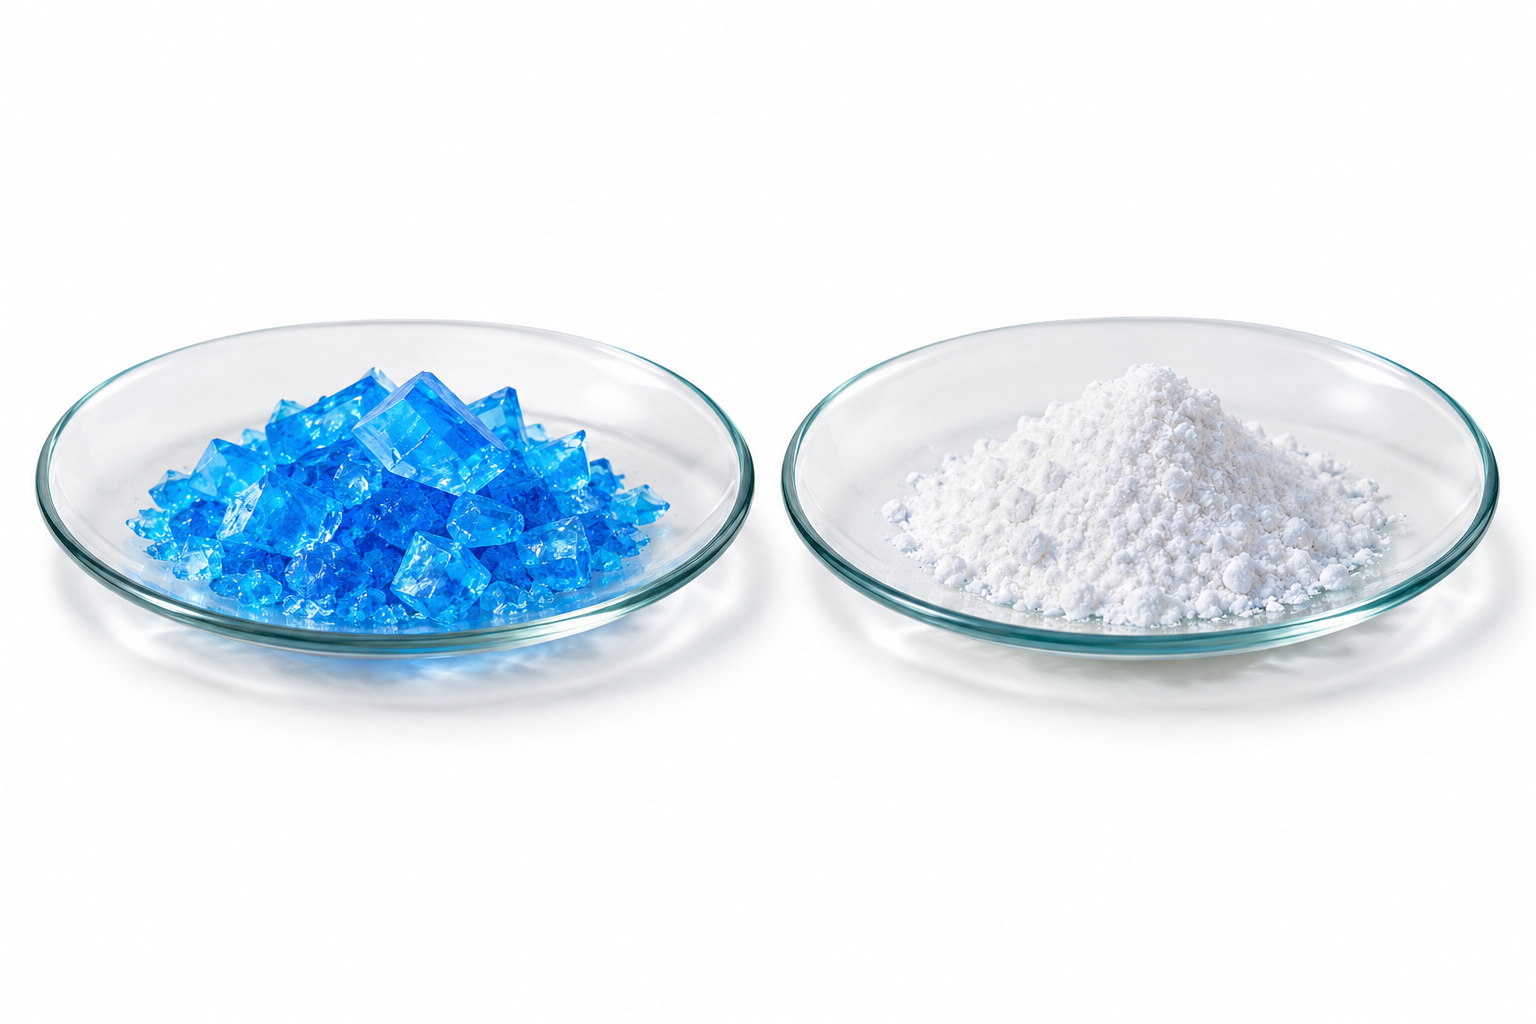
For example, hydrated copper sulfate is blue. Heating removes its water of crystallisation and produces white anhydrous copper sulfate and water: hydrated copper sulfate ⇌ anhydrous copper sulfate + water. Adding water to the anhydrous solid restores the blue colour. This is a teacher-supervised demonstration: the solid and apparatus may be hot, and copper compounds require careful handling.
Another example is ammonium chloride ⇌ ammonia + hydrogen chloride. Heating can form gases; cooling allows them to recombine. These gases are irritants, so this belongs in a properly controlled demonstration, not a home experiment.
If the forward reaction is endothermic, the reverse is exothermic. For the same quantities, the sizes of the energy transfers are equal but their directions are opposite.
Heating hydrated copper sulfate takes in energy to remove water. Adding water back releases energy. If a reversible reaction transfers 75 kJ to its surroundings in the forward direction, the reverse takes in 75 kJ for the same quantities.
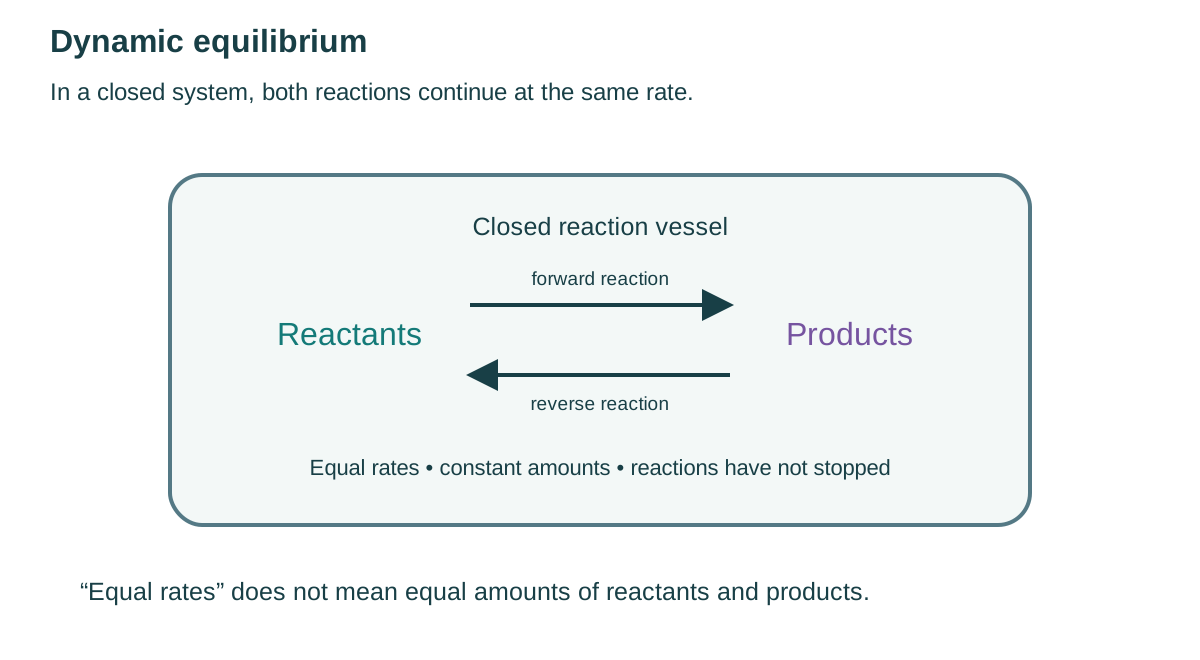
In a closed system, reactants and products cannot escape. A reversible reaction may reach dynamic equilibrium. The forward and reverse reactions continue at equal rates, so the amounts of reactants and products remain constant.
“Dynamic” means changes are still happening at particle level. “Equilibrium” means the two changes balance. Equal rates do not require equal amounts: the mixture may contain much more product than reactant, or the other way round.
If a gas escapes, the closed-system condition is not met. A closed system can still exchange energy with its surroundings; “closed” refers to matter not escaping.
Higher only. The position of equilibrium describes the relative amounts of reactants and products. Le Chatelier’s principle says that when conditions change, the system responds in a direction that opposes that change.
For A + B ⇌ C, adding A makes the forward reaction favoured until a new equilibrium forms: more C is made. Removing C also favours the forward direction, replacing some of the C removed. Adding C favours the reverse direction. The response reduces the disturbance; it does not necessarily return every concentration to its original value.
Higher only. Raising temperature favours the endothermic direction, which takes in energy. Lowering temperature favours the exothermic direction, which releases energy.
| Forward reaction | Increase temperature | Decrease temperature |
|---|---|---|
| Exothermic | Less product at equilibrium | More product at equilibrium |
| Endothermic | More product at equilibrium | Less product at equilibrium |
Keep rate and equilibrium separate. A higher temperature usually makes reactions faster, but can reduce the equilibrium amount of a desired product if its formation is exothermic. Use the equation and energy information supplied in the question.
Higher only. Increasing pressure favours the side with fewer gas molecules; decreasing pressure favours the side with more. Count the numbers before gaseous formulae in the balanced equation.
For N₂(g) + 3H₂(g) ⇌ 2NH₃(g), four molecules of reactant gases form two molecules of product gas. Increasing pressure favours ammonia formation. If both sides have the same number of gas molecules, pressure has no effect on equilibrium position.
A catalyst speeds up both directions and lets equilibrium be reached sooner. It does not change equilibrium position. Industrial choices may balance rate, equilibrium product amount, energy cost and the cost of high-pressure equipment; use the data supplied rather than assuming one condition is always best.
Start with the 43 main questions. Higher-only questions are labelled. You can complete this topic over several sessions; your answers save as you go. Use a hint if you get stuck, then compare your work with an example answer. Your tutor can mark written answers.
| Relative thiosulfate concentration | Time 1 / s | Time 2 / s | Time 3 / s |
|---|---|---|---|
| 1.00 | 24 | 26 | 25 |
| 0.50 | 49 | 51 | 50 |
| 0.25 | 98 | 102 | 100 |
Calculate each mean time and 1/mean time. Decide whether these results support the hypothesis that relative rate is proportional to concentration over this range. Explain two controls for the cross method and one advantage of collecting gas at regular intervals instead.
Mean times: 25, 50 and 100 s. Relative rates: 0.040, 0.020 and 0.010 s⁻¹. Halving concentration halves relative rate in these results, supporting the hypothesis over the tested range. Keep total depth/volume, temperature, acid amount, flask, cross and viewing conditions fixed. Gas-volume readings show a curve and how rate changes over time, while disappearance gives only one endpoint.
When connected with your pupil code, your answers save online for Kevin to see. Click Submit to Kevin when you have finished. Downloads are optional.
Connect with your pupil code above to submit.
Use a scientific idea and a specific example in your reflection.